El Niño Winter Forecast: What to Expect by Region
Updated: June 14, 2026 · 7 min read
TL;DR
El Niño winter forecast for North America: warmer and drier in the north (Canada, Pacific Northwest), wetter and cooler in the south (California to Florida). Storm activity shifts southward.
How El Niño Changes Your Winter
El Niño doesn't just warm the Pacific — it reroutes the jet stream that controls winter weather across North America. During an El Niño winter, the subtropical jet stream strengthens and shifts southward, steering Pacific storms into California and the southern US while leaving the Pacific Northwest drier than normal. The polar jet stream stays farther north, which means milder temperatures for the northern states.
These patterns are not guarantees — other climate factors like the Arctic Oscillation and Madden-Julian Oscillation can override the El Niño signal for weeks at a time. But the broad pattern is one of the most reliable seasonal forecasts in meteorology. Here's what it means for each region.
California and the Southwest
California is ground zero for El Niño winter impacts. The strengthened subtropical jet aims directly at the West Coast, delivering more frequent and more intense Pacific storms. During the 1997-98 Super El Niño, downtown Los Angeles recorded 31 inches of rain — more than double its average. The 2015-16 El Niño brought near-record Sierra Nevada snowpack that effectively ended California's five-year drought.
What to expect: above-average rainfall from December through March, with the highest odds in Southern California. Sierra Nevada snowpack typically runs 120-150% of normal during moderate to strong El Niño events. Flooding and mudslides become real risks, especially in recent burn scar areas. If you live in a flood-prone area, check your insurance and have sandbags ready by November.
The Southern Tier: Texas to Florida
Texas, Louisiana, and the Gulf Coast states typically see cooler, wetter winters during El Niño. The subtropical jet feeds moisture from the Pacific across Mexico and into the Gulf states. This pattern suppressed the severe drought in Texas during the 2015-16 El Niño. Florida often experiences more frequent severe thunderstorms and an elevated tornado risk during El Niño winters — the 1997-98 event spawned one of the deadliest tornado outbreaks in Florida history in February 1998.
What to expect: 20-40% more winter rainfall, cooler daytime temperatures, and a slightly elevated risk of severe weather. Gardeners can take advantage of the extra moisture with winter cover crops.
Pacific Northwest: Drier and Warmer
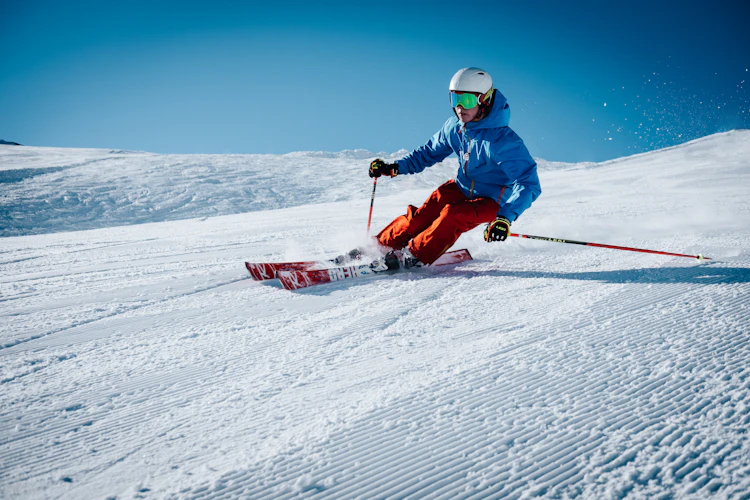
While California gets soaked, the Pacific Northwest often gets the opposite treatment. The southward-shifted jet stream diverts storms away from Washington, Oregon, and British Columbia. The 2015-16 El Niño produced one of the snow-poorest winters on record for the Cascades, with ski resorts opening weeks late or not at all. The region also runs warmer — Portland and Seattle can run 2-4°F above normal.
What to expect: below-normal mountain snowpack, which affects summer water supply and wildfire risk. If you depend on snow for recreation or water, plan for a shorter season.
Midwest and Great Lakes
The Midwest gets a break during El Niño winters. The polar jet stream, which typically funnels Arctic air into the region, stays locked in Canada. The result: warmer temperatures, less lake-effect snow, and lower heating bills. Chicago and Detroit can run 2-5°F above average, and the number of sub-zero days drops sharply. The downside is that precipitation often comes as freezing rain rather than snow when temperatures hover near the freezing mark.
What to expect: lower heating costs (10-20% below normal), fewer snow days, but watch for ice storms — the warm air aloft from the Pacific and cold air at the surface can create freezing rain setups.
Northeast: The Wildcard
The Northeast is the least predictable region during El Niño. Weak to moderate events often produce less snow and warmer temperatures. Strong El Niño events can feed powerful Nor'easters by supplying abundant Atlantic moisture. The 1997-98 winter, despite being a Super El Niño, produced relatively mild conditions for New England, while the 2015-16 event gave Washington DC its biggest January blizzard in decades.
What to expect: no strong signal either way. Keep your snow shovel handy — the increased moisture availability means that when storms do form, they can produce heavy precipitation.
What You Can Do Now
El Niño winter forecasts are among the most reliable in seasonal prediction, giving you months of lead time. Practical steps: (1) California residents — check flood zone maps and clear drainage around your home by October; (2) Pacific Northwest — plan for lower reservoir levels next summer and consider drought-tolerant landscaping; (3) Midwest — take advantage of the lower heating bills to invest in energy efficiency upgrades; (4) Southeast — review your homeowners insurance for flood coverage — standard policies don't include it.