El Niño vs La Niña: 2026 Comparison — Global Impacts Side by Side
Published: July 26, 2026 · 10 min read
TL;DR — Two Sides of the Same Pacific Cycle
El Nino and La Nina are the warm and cold phases of the ENSO cycle, producing roughly opposite global weather patterns. El Nino costs the global economy an estimated $5.7 trillion per strong event (Callahan & Mankin, 2023), while La Nina's costs are concentrated in Atlantic hurricane damage and East African drought. After a rare triple-dip La Nina from 2020-2023, the Pacific shifted to El Nino in 2023-24 and is now entering another strong El Nino in 2026 — a dramatic swing from cold-phase to warm-phase dominance. Understanding which phase benefits or harms each region is essential for agriculture, water management, and disaster planning.
How the ENSO Cycle Works

The El Nino-Southern Oscillation is a coupled ocean-atmosphere system cycling between three states: El Nino (warm phase), La Nina (cold phase), and ENSO-neutral. The physical driver is the Walker Circulation — a vast atmospheric loop of rising air over the warm western Pacific, westward-flowing upper-level winds, sinking air over the cooler eastern Pacific, and eastward-flowing trade winds at the surface. During La Nina, this circulation intensifies: stronger trade winds push even more warm water westward, cold upwelling strengthens in the east, and the west-to-east temperature gradient sharpens. During El Nino, the circulation weakens or reverses: trade winds slacken, warm water sloshes eastward, and the cold tongue in the eastern Pacific is suppressed.
The cycle is not perfectly regular. Since 1950, NOAA has classified 23 El Nino events and 20 La Nina events, with intervals ranging from 2 to 7 years. A typical El Nino persists 9-12 months, while La Nina frequently extends for 2-3 years (1998-2001, 2020-2023). The transition is driven by the discharge-recharge oscillator: during El Nino, heat stored in the western Pacific is transported eastward and released. Once enough heat has been discharged, the system snaps back — often overshooting into La Nina as cold upwelling is restored.
Global Impact Comparison Table

The table below summarizes the canonical impacts across 10 major world regions. These are statistical tendencies — individual events vary in magnitude, and the exact spatial pattern can shift by hundreds of kilometers depending on event strength and the state of other climate modes.
| Region | During El Nino (Warm Phase) | During La Nina (Cold Phase) |
|---|---|---|
| North America (USA) | Warm north, wet south. California above-average rain. Pacific Northwest dry. Gulf Coast wet. Milder northern winters. | Cold north, dry south. Pacific Northwest wet. Southern Plains and Southeast drier. More frequent Arctic outbreaks. |
| South America | Heavy coastal flooding in Peru and Ecuador. Wet in southern Brazil and Argentina. Dry in northern Brazil and Amazon. | Pacific coast normal to dry. Amazon and northeast Brazil wetter. Southern Brazil and Argentina drier. |
| Australia | Drought across eastern and northern Australia. Winter-spring rainfall 40-60% below median. Elevated bushfire risk. Wheat production reduced. | Above-average rainfall across eastern and northern Australia. Increased flood risk. Good conditions for wheat and livestock. |
| Southeast Asia | Below-normal monsoon. Drought in Thailand, Vietnam, Indonesia, Philippines. Mekong Delta salinity intrusion. Reduced rice output. Peatland fire haze. | Above-normal monsoon. Flood risk elevated. Typhoon tracks shift westward, increasing landfall probability in Philippines and Vietnam. |
| India | Weaker monsoon. Below-normal rainfall in 15 of 23 El Nino years since 1950. Kharif crop production at risk. | Stronger monsoon with above-normal rainfall. Favorable for agriculture but elevated flood risk in Ganges basin. |
| East Africa | Wetter than normal October-December short rains. Flooding risk in Kenya, Somalia, Ethiopia. 1997-98 floods killed roughly 2,000 people. | Drier than normal short rains and March-May long rains. Drought risk — 2011 and 2021-22 La Nina droughts caused severe food crises. |
| Southern Africa | Below-normal summer rainfall. Drought in Zimbabwe, Zambia, Mozambique, South Africa. 2015-16 El Nino left 40 million food insecure. | Above-normal summer rainfall. Generally favorable for maize production. Elevated flood risk in Mozambique and Zambezi basin. |
| Europe | Milder, wetter winters in southern Europe. Northern Europe tends colder. Signal weaker than for other regions — modulated by North Atlantic Oscillation. | More variable pattern. Some La Nina winters bring colder conditions to northern and central Europe. Indirect influence via stratospheric polar vortex. |
| Atlantic Hurricane Basin | Reduced activity. Increased wind shear suppresses storm development. Average 9 named storms vs 14 normally. ACE 50-75% of median. | Enhanced activity. Reduced shear and warmer Caribbean SSTs support more storms. Hyperactive 2020 and 2005 seasons occurred during La Nina. |
| Global Average Temperature |
Elevated by 0.1-0.2C above warming trend. El Nino years are typically warmest on record at time they occur. | Depressed by 0.1-0.2C below warming trend. Still warm relative to historical norms due to greenhouse gas forcing. |
The 2020-2023 Triple-Dip La Nina

The three consecutive La Nina winters of 2020-21, 2021-22, and 2022-23 were among the rarest ENSO configurations in the modern record. The 2021-22 winter reached a Nino 3.4 anomaly of -1.1C, and the 2022-23 winter held at approximately -0.8C. The persistence through three consecutive winters defied the typical discharge-recharge timescale of roughly 2 years, and researchers have linked the unusual duration to strong trade wind forcing and possible aerosol-induced tropical Pacific cooling from the 2019-20 Australian bushfires (Fasullo et al., 2023, Science Advances).
The human toll fell hardest on East Africa, which experienced five consecutive failed rainy seasons from late 2020 through early 2023 — the worst drought in at least 40 years. The UN estimated that 36 million people were affected across Ethiopia, Somalia, and Kenya, with 21 million facing crisis-level food insecurity. The southern United States — particularly Texas, Oklahoma, and the Lower Mississippi Valley — also saw persistent drought that reduced cotton yields and forced early cattle sales.
The triple-dip La Nina set the stage for a sharp ENSO reversal. The prolonged cold phase accumulated a massive heat surplus in the western Pacific warm pool. When the La Nina finally decayed in early 2023, this stored heat was released rapidly, driving the onset of the 2023-24 El Nino, which reached a peak ONI of approximately +2.0C. The ocean-atmosphere system is now completing the discharge half of the cycle: the 2026-27 El Nino represents continued warm-phase dominance after a brief neutral interlude in 2025.
Which Regions Prefer Which Phase
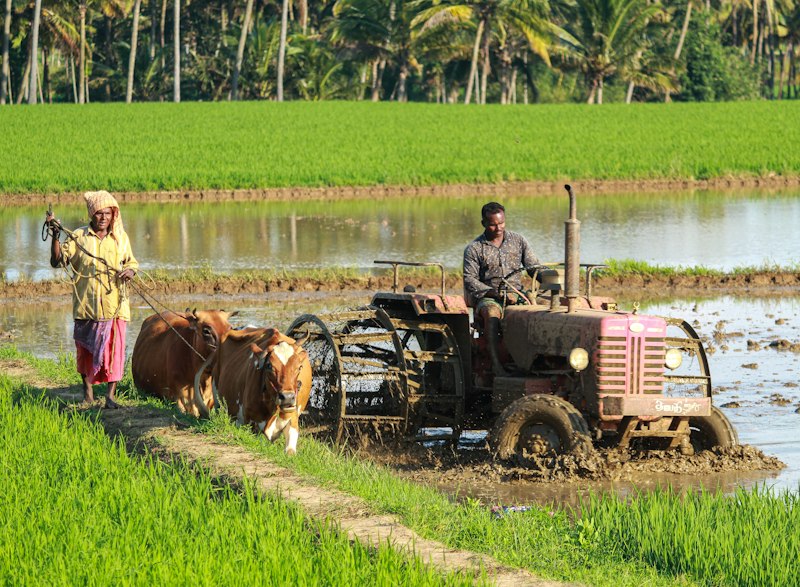
ENSO phases create clear winners and losers in global agriculture and fisheries — and the distinction is not academic. It shapes national GDP, food security, and political stability in climate-vulnerable countries.
Australian agriculture strongly prefers La Nina. The 2010-12 La Nina produced record wheat production of 29.9 million tons, while the 2015-16 El Nino cut output to 22 million tons. Indian agriculture also favors La Nina: enhanced monsoon rainfall supports the kharif crop that accounts for roughly 50% of India's annual food grain output. The 2022-23 La Nina contributed to India's record 330 million tons of food grain production.
Peru's anchoveta fishery — the world's largest single-species fishery at 4-7 million tons per year — depends on nutrient-rich upwelling that collapses during El Nino. The 1997-98 event reduced the catch from 8.8 million tons to 1.2 million tons. Southeast Asian rice farmers consistently prefer La Nina for its monsoon-enhancing effect. During the 2020-22 La Nina, Thailand and Vietnam both recorded above-trend rice exports. El Nino dries the region and triggers Mekong Delta salinity intrusion that damages rice paddies and aquaculture.
California's relationship with ENSO is nuanced. Moderate El Nino delivering 120-140% of normal Sierra Nevada precipitation is ideal for reservoir recharge; strong El Nino can bring destructive flooding, as in 1997-98. La Nina winters are typically dry — the 2021-22 drought pushed Lake Mead to its lowest level since the 1930s. Water managers note that ENSO explains only roughly 30% of California's precipitation variability.
Global Temperature and the 1.5C Threshold

ENSO is the single largest source of year-to-year variability in global mean surface temperature (GMST). El Nino releases enormous quantities of stored ocean heat to the atmosphere — roughly 0.1-0.2C of additional global warming above the greenhouse gas-driven trend. La Nina stores heat in the subsurface ocean, producing global temperatures about 0.1-0.2C below the trend. This creates a sawtooth pattern: El Nino years spike upward, La Nina years pause or decline slightly, and each new El Nino establishes a higher temperature record than its predecessor.
The 2023-24 El Nino pushed global temperatures into uncharted territory. The World Meteorological Organization's State of the Global Climate report confirmed 2023 as the warmest year on record at approximately 1.45C above the 1850-1900 baseline, and 2024 surpassed it at roughly 1.55C — likely the first calendar year to exceed the Paris Agreement's aspirational 1.5C threshold. Monthly global temperatures exceeded 1.5C above pre-industrial for 11 of 12 months in 2024.
The 2026-27 El Nino arrives when the global temperature baseline is already elevated. Even a moderate event would push annual GMST above 1.5C; a strong event (Nino 3.4 >+1.5C) would likely produce 1.6-1.7C for calendar year 2027. The UK Met Office's decadal forecast assigns a 93% probability that at least one year between 2026 and 2030 will exceed 1.5C. The more consequential question is when the 1.5C threshold is crossed as a 20-year average — the IPCC's guidance indicates this will likely occur in the early 2030s under current emissions trajectories, with strong El Nino events accelerating the approach.
The Economic Asymmetry of ENSO
Callahan and Mankin (2023, Science) estimated that the 1982-83 and 1997-98 El Ninos each caused approximately $5.7 trillion in global income losses over the five years following the event, with the 2015-16 El Nino producing similar losses. This figure far exceeds earlier estimates that tallied only direct damages without accounting for the persistent growth drag from supply chain disruption, food price inflation, and reduced investment.
The mechanism is a multi-year cascade. El Nino drought cuts agricultural output, which raises food prices, which reduces household purchasing power, which depresses demand for non-food goods and services. Governments redirect spending from infrastructure investment to disaster relief. Private investment retreats from climate-sensitive sectors. The study found that tropical countries most exposed to El Nino — in Southeast Asia, Southern Africa, and South America — experience GDP losses of 3-6% relative to counterfactual in the event year, and losses persist for 3-5 years before full economic recovery.
La Nina's economic costs are smaller and more geographically concentrated. The primary channels are enhanced Atlantic hurricane activity (the 2020 season produced $51 billion in US damage), flooding in Australia and Southeast Asia, and drought in East Africa and the southern US. The global aggregate is roughly one-third to half of El Nino's toll, reflecting La Nina's more localized and less synchronized impacts across major agricultural regions. This asymmetry is significant for climate risk modeling: assessments that treat El Nino and La Nina as symmetric risks will systematically underestimate the economic cost of ENSO variability.
Climate Change and Future ENSO Behavior
The IPCC Sixth Assessment Report (2021) concluded with medium confidence that strong El Nino frequency may increase under continued warming, based on CMIP6 projections where roughly 60% of models show an increase under RCP 8.5. The physical basis is enhanced upper-ocean stratification: as the surface warms faster than the subsurface, the thermocline sharpens, meaning subsurface warm water produces a larger SST anomaly when it surfaces. Cai et al. (2019, Nature) projected very strong El Nino frequency could increase from roughly once every 20 years to once every 10 years by 2100.
The observational record is consistent with this projection but too short for definitive attribution. Four of the six strongest ONI values since 1950 have occurred since 1982: 1982-83 (+2.2C), 1997-98 (+2.4C), 2015-16 (+2.3C), and 2023-24 (+2.0C). This clustering is statistically improbable under a stationary climate. However, paleoclimate reconstructions from corals and tree rings suggest the 20th century was relatively quiet for ENSO compared to earlier centuries, raising the possibility that the recent clustering partially reflects a natural swing back toward higher variance rather than a purely anthropogenic signal.
What is clearer is that regardless of frequency changes, ENSO impacts are intensifying because the background climate is warmer. A moderate El Nino in 2026 occurs in an atmosphere that holds roughly 7% more water vapor per degree Celsius of warming (Clausius-Clapeyron), amplifying extreme rainfall in wet regions. Simultaneously, higher background temperatures increase evaporative demand, intensifying drought in dry regions. The practical consequence: even a statistically normal El Nino now unfolds in a physically abnormal climate. The 2026-27 event will test how global agriculture, water systems, and humanitarian response cope with a strong ENSO event in a world more than 1.5C above pre-industrial temperatures.