While El Niño is associated with drought in many regions, it also brings catastrophic flooding to specific parts of the world. The 1997-98 El Niño caused $35 billion in flood damage globally, displaced 3.5 million people in East Africa, and triggered Peru's worst flooding on record. Understanding which regions flood during El Niño — and why — can save lives, property, and billions in economic losses.
The Atmospheric Mechanism

During El Niño, the warm pool of water in the central and eastern Pacific shifts global atmospheric circulation. The Walker circulation weakens, convection shifts eastward, and the jet stream intensifies and dips south over the eastern Pacific. This steers moisture-laden storm systems toward the west coasts of North and South America. Simultaneously, the Indian Ocean warms, enhancing evaporation and monsoon rainfall over East Africa. These teleconnections are the direct cause of El Niño flooding.
Peru and Ecuador: The Ground Zero
Coastal Peru and Ecuador experience the most direct El Niño flooding. Normally arid coastal regions can receive 10-30 times their average rainfall. During the 2017 coastal El Niño (a weaker variant), Piura, Peru received 15 times its normal rainfall in a single month — the Piura River overflowed, destroying 100,000 homes and causing $3.1 billion in damage. The 1997-98 event was even worse: the Sechura Desert in northern Peru temporarily turned into the second-largest lake in South America, measuring 5,000 square kilometers.
California: Atmospheric River Onslaught
El Niño winters in California are characterized by atmospheric rivers — narrow corridors of concentrated moisture that can deliver as much water as the Mississippi River mouth in a single storm. The 1997-98 El Niño brought 31 inches of rain to parts of California in February alone, causing mudslides that destroyed homes across 17 counties. The 2023-24 El Niño contributed to back-to-back atmospheric rivers that dropped a year's worth of rain on Los Angeles in three days. However, not every El Niño guarantees a wet California winter — the 2015-16 "Super El Niño" largely missed California due to unfavorable atmospheric patterns, a reminder that El Niño shifts the odds but doesn't dictate outcomes.
East Africa: The Paradox of Flooding
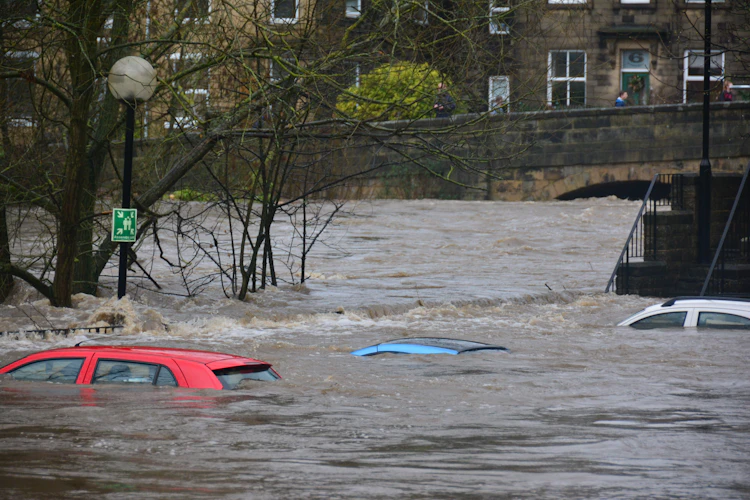
During El Niño, the western Indian Ocean warms anomalously, enhancing evaporation and pulling moisture into East Africa. Countries from Somalia to Mozambique experience increased rainfall. The 1997-98 El Niño brought flooding that killed 3,500 people in Somalia, destroyed 70% of Kenya's road infrastructure, and triggered a Rift Valley fever outbreak as floodwaters expanded mosquito habitat. The 2023-24 El Niño coincided with devastating floods in Kenya and Somalia that displaced over 1 million people.
Southern Brazil, Paraguay, and Uruguay
The La Plata Basin in southeastern South America consistently receives above-average rainfall during El Niño, particularly during austral spring and early summer (October-December). The 2015-16 El Niño caused major flooding along the Paraguay River that displaced 150,000 people in Paraguay and caused $500 million in agricultural losses across the region.
US Southeast and Gulf Coast: Winter Flood Hazard
A less well-known El Niño flood zone is the US Southeast. During strong El Niño winters, the southward-shifted jet stream directs a near-continuous stream of storm systems across Florida, Georgia, Alabama, and the Carolinas. The result is not the flash flooding of a single atmospheric river but the cumulative effect of weeks of above-normal rainfall on already saturated soils. The 1997-98 El Niño produced 150-200% of normal winter rainfall across Florida, with the Suwannee and St. Johns rivers exceeding flood stage for weeks. The 2023-24 event brought similar conditions, with Atlanta recording a 45% increase in February rainfall and widespread flooding across the Florida Panhandle. The US Southeast should prepare for elevated flood risk during the 2026-27 winter.
Regional Economic Impact Comparison
The economic toll of El Niño isn't evenly distributed. Some regions absorb glancing blows while others take direct hits. The map below shows how flooding varies across the most vulnerable regions — and why preparedness investments produce vastly different returns depending on where you are.
| Region | Estimated GDP Impact | Primary Channel | Recovery Time |
|---|---|---|---|
| Southeast Asia | -0.5% to -2.0% | Agriculture + drought | 1–2 years |
| Andean South America | -1.0% to -3.0% | Fisheries + flooding + infrastructure | 2–4 years |
| East Africa | -0.5% to -1.5% | Agriculture + food imports | 1–2 years |
| Southern Africa | -1.0% to -2.5% | Drought + hydropower | 2–3 years |
| Australia | -0.3% to -1.0% | Agriculture + bushfire costs | 1 year |
| India | -0.2% to -1.0% | Monsoon agriculture | 1–2 years |
| Central America | -1.0% to -2.0% | Drought + coffee/banana exports | 2–3 years |
The most vulnerable countries are those where agriculture accounts for a large share of GDP AND the climate is strongly teleconnected to ENSO. A country like Peru, where the fishing industry alone represents ~2% of GDP and is directly disrupted by El Niño warming, feels the impact faster and harder than a diversified economy with weaker ENSO links.
For the 2026-2027 event, the economic exposure is compounded by already-strained fiscal positions in many developing countries following the pandemic recovery period. Limited fiscal space means less capacity to absorb shocks through government spending — making early warning and preparedness even more critical.